
This page provides a live look into my coding activity over the past 30 days, pulling data directly from my WakaTime profile. What is WakaTime? It’s basically a timekeeping tool, it is how I keep track of how much time I spend doing computer programming activities. It does this through a plugin, and it’s how I can quantitively track how i spend my time.
A significant amount of time is spent in my code editor, or “browsing” which is actually me just reading alot of documentation, exploring github reading and trying to understand just enough so that I can determine if what i’m reading is the bridge that spans my knowledge gaps. It’s supposed to excludes all social media, or any non “productivity” sites, and only tracks whats in focus. So if you were like me and wondering where your time goes, and you spend that time on your computer, WakaTime is a great and useful resource.
Quick Visual Overview
So you can just get a link within WakaTime that will display your current stats. You can select from a few chart styles such as these 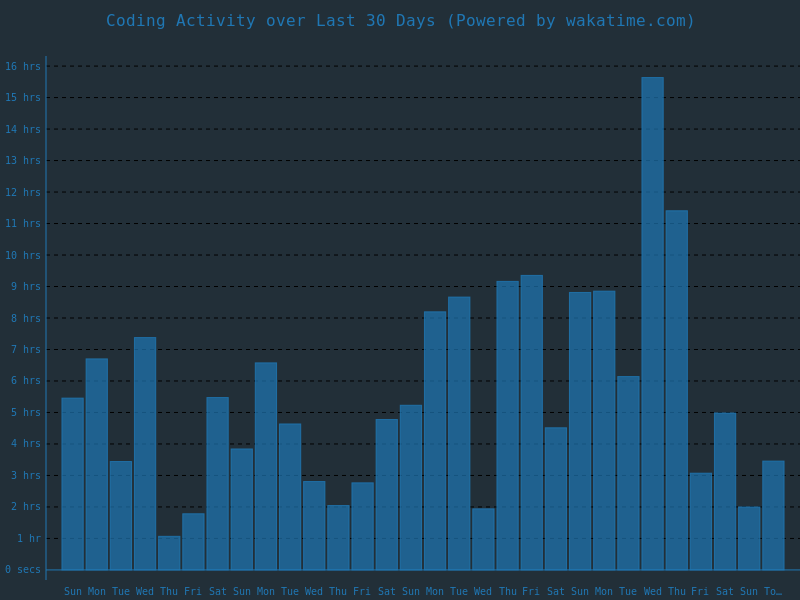
Easy as that, just copy and paste the links into here you want them.
30-Day Snapshot
Loading insights...
Here are some key statistics pulled from the last 30 days of activity.
Coding Activity
This chart visualizes my coding hours per day. Use the dropdown to switch between different chart styles.
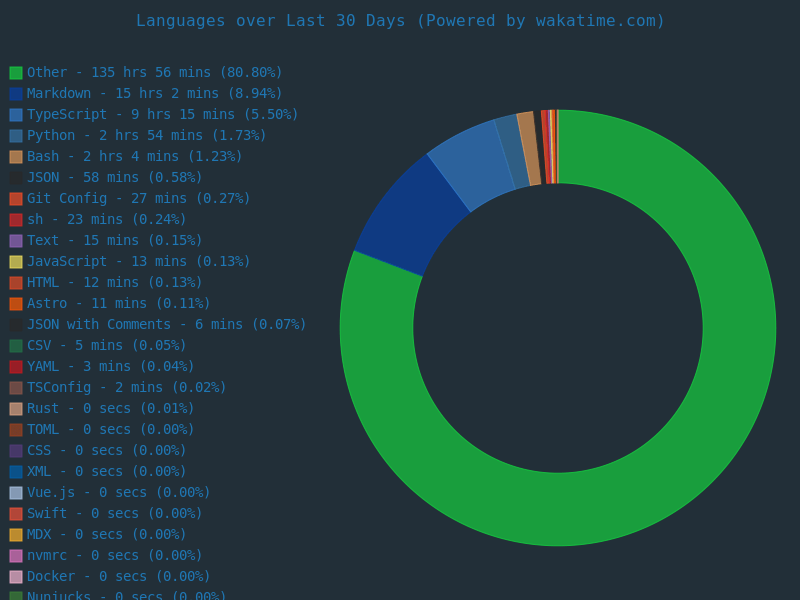
Languages
Language Rankings
This chart shows the breakdown of programming languages I’ve used recently.
30-Day Coding Calendar
This calendar provides an at-a-glance heatmap of my coding intensity over the last 30 days.
How It Was Made
This dashboard was built using Astro and Chart.js. It fetches data from public WakaTime JSON endpoints and renders it into several interactive visualizations. The calendar heatmap provides a quick overview, while the charts allow for a more detailed look at daily activity and language usage. All the logic for fetching, processing, and rendering is handled by client-side TypeScript, broken into modular components for maintainability.